I spent many years teaching for Learning Tree International, New Horizons, and privately. That has given me a very formal perspective on presenting complex material that isn’t yet understood to people who are much smarter than I am.
I’ve also created an enormous number of models and diagrams over the years to present to clients. And I’ve been in the meetings when others present their diagram sets as well.
Having made the mistakes, watched the mistakes, and sometimes even avoided the mistakes, there’s a very basic trap that I want to spare all my fellow modelers and diagram authors — and it’s one I see still at all levels of organizations.
The trap is this: showing the big picture first.
I understand that you should “tell them what you’re going to say, say it, and tell them what you said.” Perhaps. But if you show a complex diagram (more than two or three boxes) that you expect to explain in detail, it’s only going to go downhill from there.
But That’s What They Say!
The advice to show the big picture, then to zoom in and explain sections is wrong.
Yeah, I’m not citing a source. Why? Because I’m making the claim directly. From first hand observation.
Here is a common scenario:
Presenter: Thank you all for coming. This shows the dynamic relationships at runtime when there’s a reliable protocol connection in play. I’ll explain each part in detail in later slides.
And the presenter shows a diagram. I have shrunk it so that it’s not readable. Don’t attempt to expand it, I screen-shotted the shrunk version so that the detail is lost:

Immediately, someone says: I don’t understand why <insert question about an arbitrary box here>.
And it goes downhill from there. Even though in three or four slides, when there’s context, that “box being questioned” is explained and the explanation is reasonable, the presentation is derailed and no matter how much time is allocated for the meeting the presentation will never actually reach the slides that discuss each of the boxes.
But WHY?
Because inevitably the meeting (or class) attendees know some of what they see. They ask about the part they don’t. Isn’t the purpose of the meetings to solicit feedback and bring everyone to the same page, etc.? And so, asking is actually not wrong — the attendee sees what’s presented and asks.
In short: blaming the attendees is both foolish and counter-productive. The failing isn’t theirs, and they’re not behaving badly. They are trying to understand what was shown.
The mistake is the presenter’s.
Showing the Big Picture Is Needed Though
Now, that tiny busy diagram I showed sure does let you know that I did something. And, for what it’s worth, that diagram is honest and it really is what I used and presented in building something.
Because it’s genuinely impossible to read, though, the only questions might be “What kind of diagram is that?” (an object, not class, diagram, using UML) or perhaps “Why did you pick that garish orange for those three boxes?”
My tiny diagram lets the audience know there’s a lot coming, but it doesn’t let them get sidetracked.
When you feel the need to make the point that there’s a lot to see, by all means, show them — but don’t allow them to see enough to derail the presentation!
Communication Means All Parties Share the Same Understanding
Now that you’ve intimidated your audience with the intimidation diagram (that’s what I call the “full big picture”) take the thing down and step them through what’s needed for them to actually understand the point that the diagram captures.
I’m not going to explain everything (or even much) of that monster, but in order to start explaining what this facility does, I’d start with this piece of that beast:

At this point, I can explain that I have three participating agents, and what they do. Any questions I get will just be about those agents. They aren’t even connected (how they connect is the subject of later slides).
I might have even shown just one of the boxes. And explained it. And had a slide for each (three slides instead of the one).
Then I’d add more details, always adding a small amount that I was ready to explain.
The goal isn’t to try to point to each box with a laser pointer and show how magnificent your intimidation diagram is!
Help them understand each step.
And Then the Intimidation Diagram Which Isn’t Intimidating!
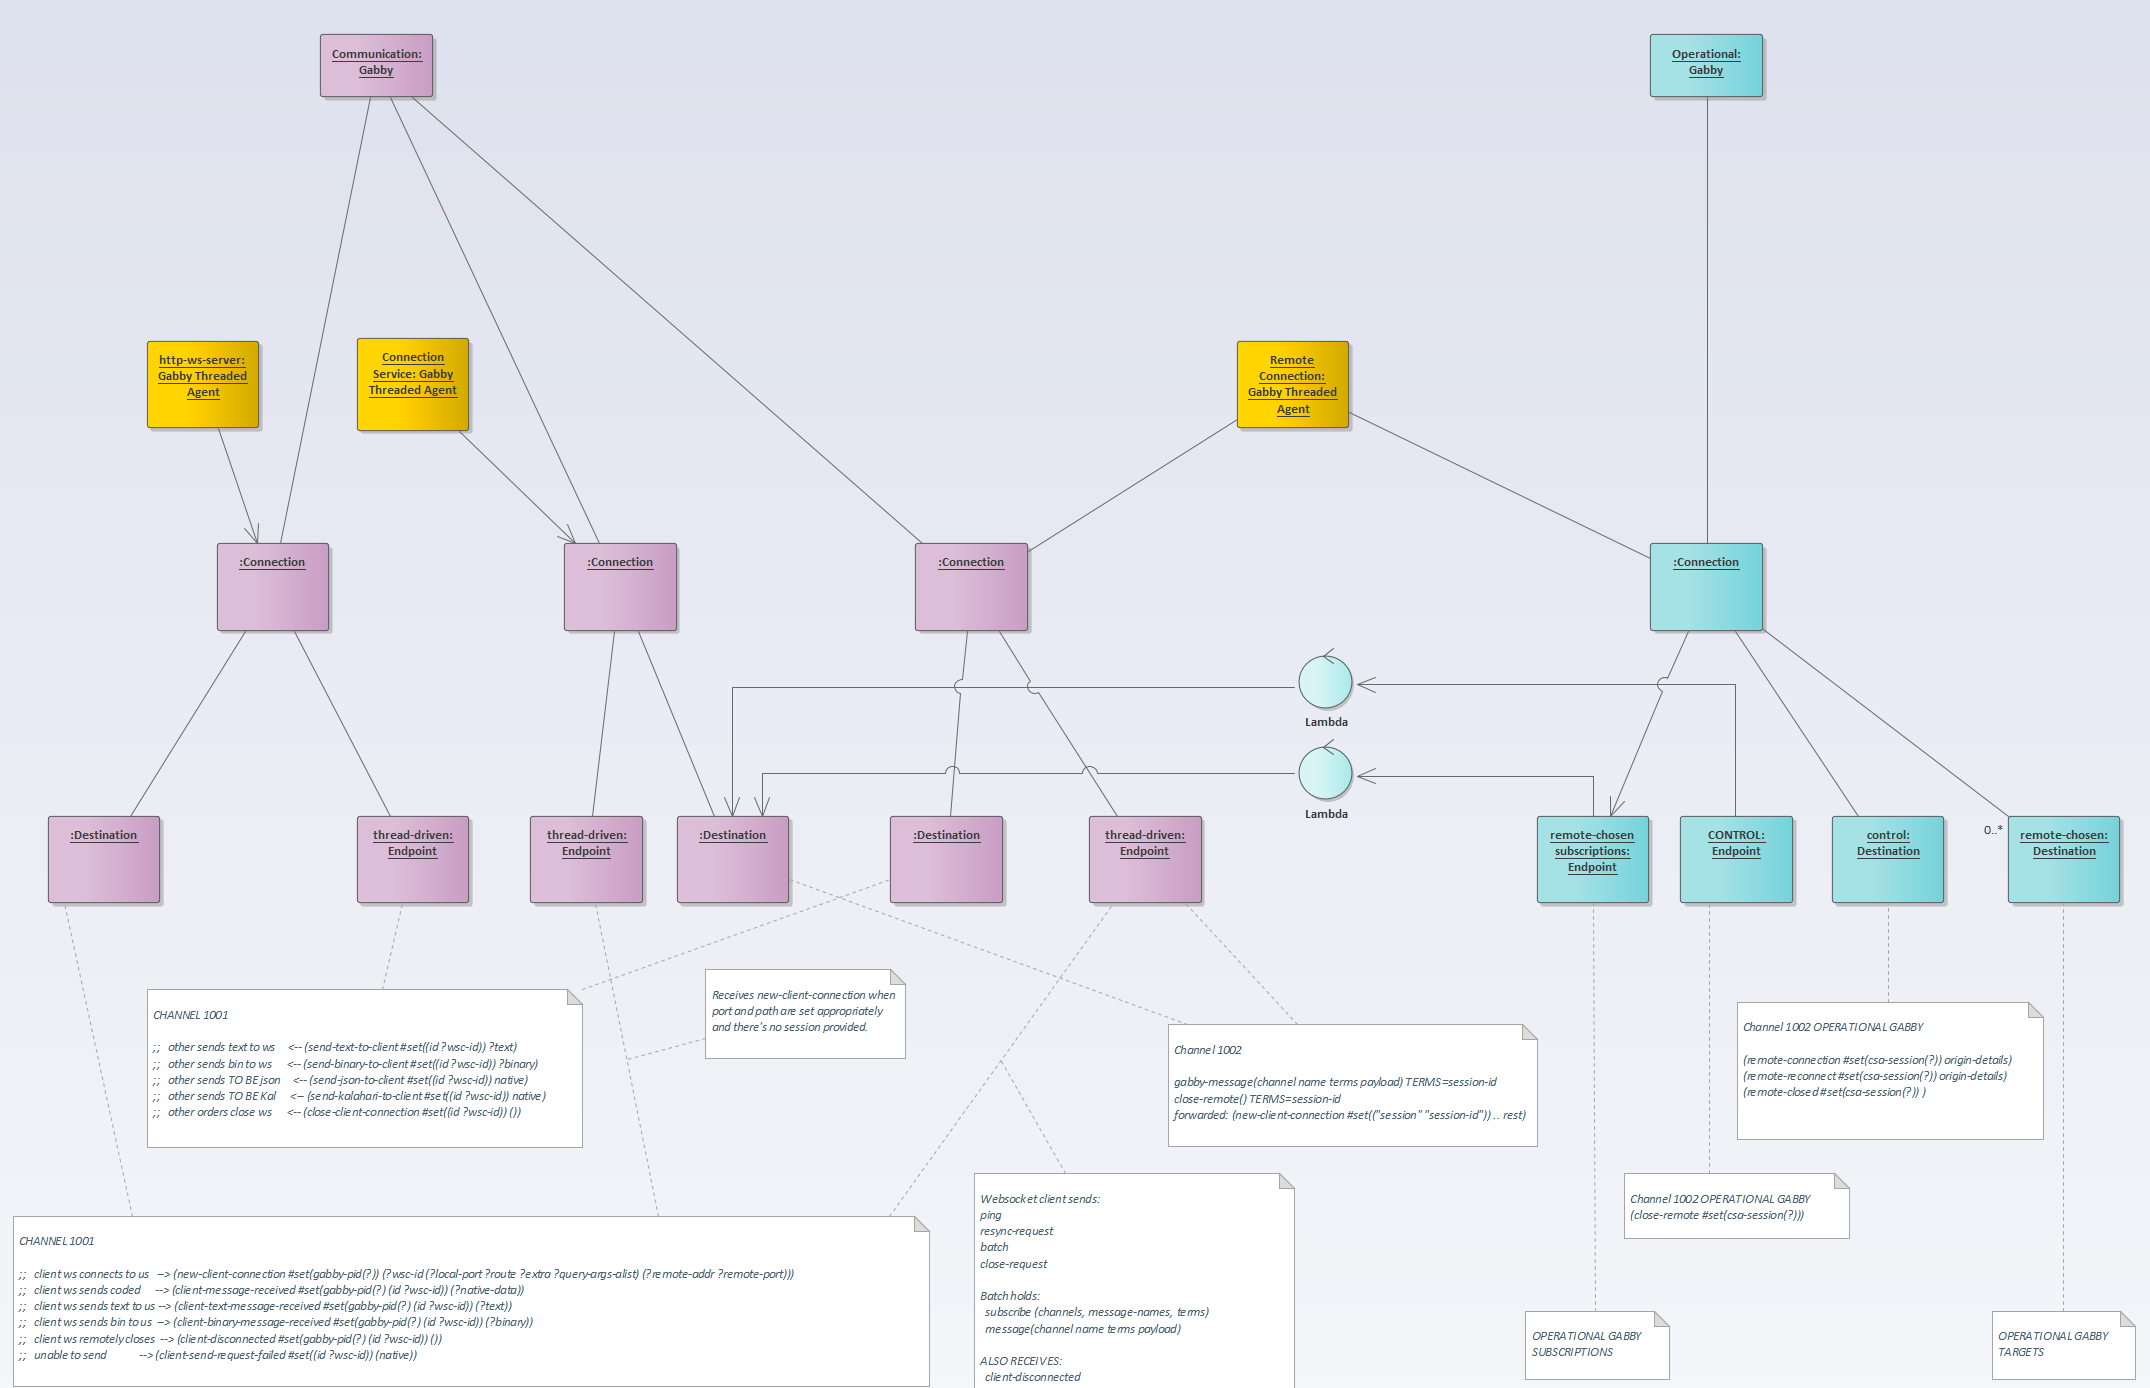
At the end, you’re free to show the whole diagram. It won’t fit (my diagram fills a 4K display) but you’ll have the instructions for how to see it (or at least a URL to the full diagram) in your materials for them to review.
While it’s useless without the slides that would have explained it, here in fact is the full diagram (you may need to zoom or download it):
The Power of the Intimidation Diagram
Sometimes, the reason for showing the whole diagram is precisely to say “This is complex and hard and you don’t understand it so leave me alone.” I was spending time at Intel in the 80s and one of their engineers used a full trace for the 80286 processor on the wall precisely for that purpose. When someone who wasn’t technical would bother him, he’d lead them to the wall and point to a section. “Look, this is what we’ve got right now. What do you want me to change?” Of course, it was a ridiculous question.
I’ve seen the same effect in DBA offices. There will be a diagram on the wall with all of the tables across a cluster of databases. Thousands of tables with small fonts and lines going everywhere. What’s funny, it looks a like like the diagram of that 80286 … The reason for that “big picture” view is so that it’s clear how monumental an undertaking it is to corral all those tables.
The best DBAs, of course, don’t work of some giant wall. They’ve got tools to draw in the relations of concern and see just the set needed for any task.
The Reason for CASE Tool Instead of Drawing Tool
The ability to have both a full picture (intimidation diagram) and a suite of certain to be in agreement sub-diagrams demands tooling beyond drawing. In particular, you need a CASE tool that supports models such that diagrams are reflections of the underlying models. Change the model, and all the diagrams will reflect the changes.
I use Enterprise Architect from Sparx Systems. It’s commercial, and it’s a wonderful tool (I don’t have any affiliate relation, this is not a paid review). In EA, I’m able to build up my models in stages and keep them current. In my article on Rethinking State Machines I had a few series of diagrams. This was the view in the case tool that showed how each diagram in one of the series was consistent:

People who use drawing packages, where each drawing “stands alone” can make wonderful diagrams, but they can’t easily keep them all in agreement. And a diagram that isn’t accurate is a danger and not a benefit.
With a good case tool, even when changes happen (and they do) the diagrams stay consistent and a presentation can be updated.
I’ve presented from EA instead of going to Powerpoint before. In fact, EA can also emit full websites with all the details, diagrams, models, etc. But I find it easier to present from EA itself because if during the meeting I discover (or more likely someone else discovers) an error and I can fix it immediately and suddenly the benefit of the CASE tool becomes obvious.
Avoid the Trap!
I’ve sat beside frustrated team members after meetings countless times trying to explain this trap to them. They agree, and then the next presentation, they make the same mistake.
Humor me if you don’t believe me, and try it out. Once they do actually try to guide their audience instead of fight them, they make it through their deck and the meeting is often successful.
